


Lightning Graph - Strikes Recorded by South Bergen Weather
The following graph is produced by South Bergen Weather based on lightning strikes recorded by a detector located on site.
File updated at: 12:19 am Tuesday, February 18

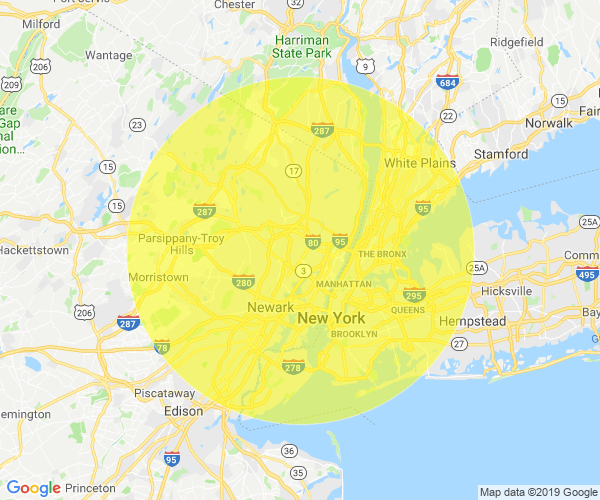
Below is the approximate range in which the lightning detector can pick up strokes:
Lightning Map - Last 2 Hours

This lightning map is generated by the Blitzortung Network, a non-profit community collaberative project. Several operators posses detection stations, and the data is pooled together on a central server and displayed on this map. If you are interested in covering your area or to find out more, visit blizortung.org. To see more maps, visit lightningmaps.org.
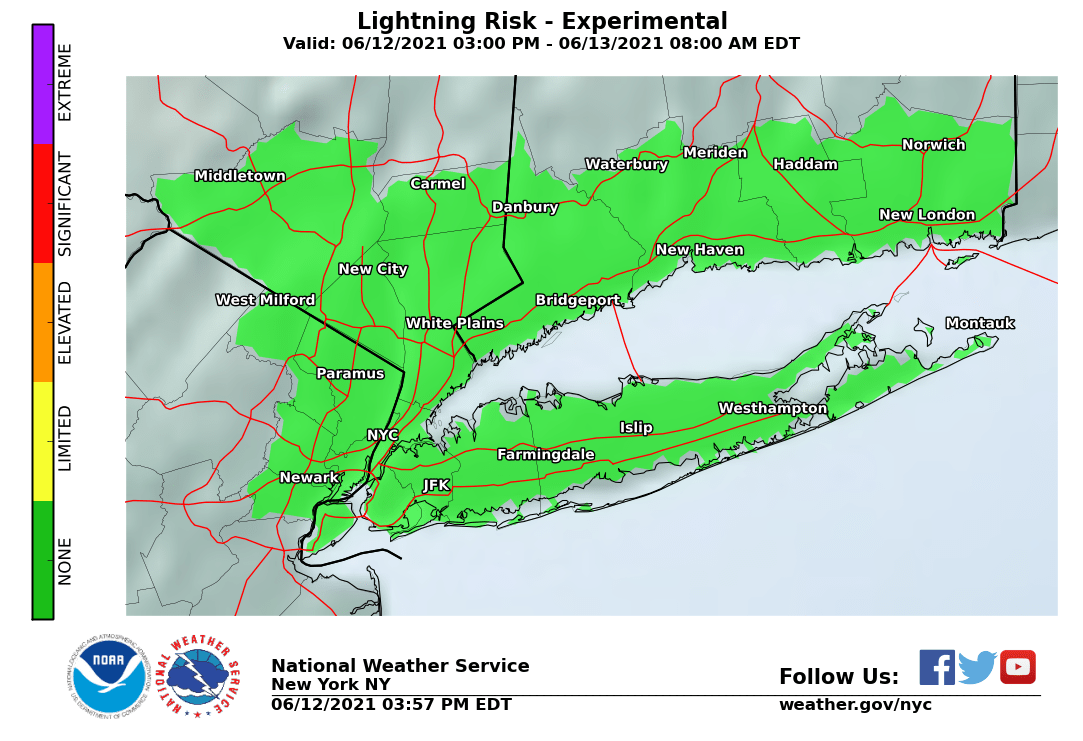
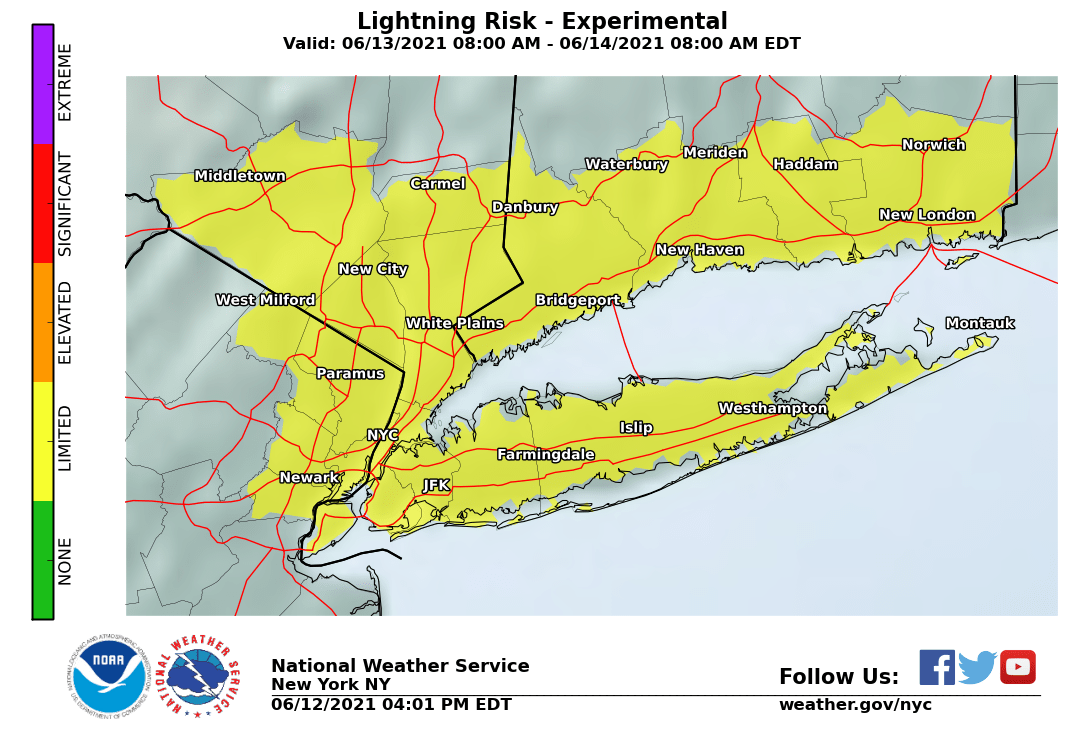
Risk